What follows is the talk I delivered on behalf of the TOME project team at the Digital Humanities 2014 conference. We’re in the process of writing up a longer version with more technical details, but in the interim, feel free to email me with any questions.
NB: For display purposes, I’ve removed several of the less-essential slides, but you can view the complete slidedeck here.
Just over a hundred years ago, in 1898, Henry Gannett published the second of what would become three illustrated Statistical Atlases of the United States. Based on the results of the Census of 1890– and I note, if only to make myself feel a little better about the slow pace of academic publishing today, eight years after the census was first compiled– Gannett, working with what he openly acknowledged as a team of “many men and many minds,” developed an array of new visual forms to convey the results of the eleventh census to the US public.
 The first Statistical Atlas, published a decade prior, was conceived in large part to mark the centennial anniversary of the nation’s founding. That volume was designed to show the nation’s territorial expansion, its economic development, its cultural advancement, and social progress. But Gannett, with the centennial receding from view, understood the goal of the second atlas in more disciplinary terms: to “fulfill its mission in popularizing and extending the study of statistics.”
It’s not too much of a stretch, I think, to say that we’re at a similar place in the field of DH today. We’re moved through the first phase of the field’s development– the shift from humanities computing to digital humanities– and we’ve addressed a number of public challenges about its function and position in the academy. We also now routinely encounter deep and nuanced DH scholarship that is concerned digital methods and tools.
And yet, for various reasons, these tools and methods are rarely used by non-digitally-inclined scholars. The project I’m presenting today, on behalf of a project team that also includes Jacob Eisenstein and Iris Sun, was conceived in large part to address this gap in the research pipeline. We wanted to help humanities scholars with sophisticated, field-specific research questions employ equally sophisticated digital tools in their research. Just as we can now use search engines like Google or Apache Solr without needing to know anything about how search works, our team wondered if we could develop a tool to allow non-technical scholars employ another digital method– topic modeling– without needing to know how it worked. (And I should note here that we’re not the first to make this observation about search; Ben Schmidt and Ted Underwood, as early as 2010, have also published remarks to this end).
 Given this methodological objective, we also wanted to identify a set of humanities research questions that would inform our tool’s development. To this end, we chose a set of nineteenth-century antislavery newspapers, significant not only because they provide the primary record of slavery’s abolition, but also because they were one of the first places, in the United States, where men and women, and African Americans and whites, were published together, on the same page. We wanted to discover if, and if so, how these groups of people framed similar ideas in different ways.
For instance, William Lloyd Garrison, probably the most famous newspaper editor of that time (he who began the first issue of The Liberator, in 1831, with the lines, “I will not equivocate — I will not excuse — I will not retreat a single inch — AND I WILL BE HEARD”) decided to hire a woman, Lydia Maria Child, to edit the National Anti-Slavery Standard, the official newspaper of the American Anti-Slavery Society. Child was a fairly famous novelist by that point, but she also wrote stories for children, and published a cookbook, so Garrison thought she could “impart useful hints to the government as well as to the family circle.” But did she? And if so, how effective– or how widely adopted– was this change in topic or tone?
 The promise of topic modeling for the humanities is that it might help us answer questions like these. (I don’t have time to give a background on topic modeling today, but if you have questions, you can ask later). The salient feature, for our project, is that these models are able to identify sets of words (or “topics”) that tend to appear in the same documents, as well as the extent to which each topic is present in each document. When you run a topic model, as we did using MALLET, the output typically takes the form of lists of words and percentages, which may suggest some deep insight — grouping, for example, woman, rights, and husband — but rarely offer a clear sense of where to go next. Recently, Andrew Goldstone released an interface for browsing a topic model. But if topic modeling is to be taken up by non-technical scholars, interfaces such as this must be able to do more than facilitate browsing; they must enable scholars to recombine such preliminary analysis to test theories and develop arguments.
 In fact, the goal of integrating preliminary analytics with interactive research is not new; exploratory data analysis (or EDA, as it’s commonly known) has played a fundamental role in quantitative research since at least the 1970s, when it was described by John Tukey. In comparison to formal hypothesis testing, EDA is more, well, exploratory; it’s meant to help the researcher develop a general sense of the properties of his or her dataset before embarking on more specific inquiries. Typically, EDA combines visualizations such as scatterplots and histograms with lightweight quantitative analysis, serving to check basic assumptions, reveal errors in the data-processing pipeline, identify relationships between variables, and suggest preliminary models. This idea has since been adapted for use in DH– for instance, the WordSeer project, out of Berkeley, frames their work in terms of exploratory text analysis. In keeping with the current thinking about EDA, WordSeer interweaves exploratory text analysis with more formal statistical modeling, facilitating an iterative process of discovery driven by scholarly insight.
 EDA tends to focus on the visual representation of data, since it’s generally thought that visualizations enhance, or otherwise amplify, cognition In truth, the most successful visual forms are perceived pre-cognitively; their ability to guide users through the underlying information is experienced intuitively; and the assumptions made by the designers are so aligned with the features of their particular dataset, and the questions that dataset might begin to address, that they become invisible to the end-user.
 So in the remainder of my time today, I want to talk through the design decisions that have influenced the development of our tool as we sought to adapt ideas about visualization and EDA for use with topic modeling scholarly archives. In doing so, my goal is also to take up the call, as recently voiced by Johanna Drucker, to resist the “intellectual Trojan horse” of humanities-oriented visualizations, which “conceal their epistemological biases under a guise of familiarity.” What I’ll talk through today should, I hope, seem at once familiar and new. For our visual design decisions involved serious thinking about time and space, concepts central to the humanities, as well as about the process of conducting humanities research generally conceived. So in the remainder of my talk, I’ll present two prototype interface designs, and explain the technical and theoretical ideas that underlie each, before sketching the path of our future work.
 Understanding the evolution of ideas– about abolition, or ideology more generally– requires attending to change over time. Our starting point was a sense that whatever visualization we created needed to highlight, for the end-user, how specific topics–such as those describing civil rights and the Mexican-American War, to name two that Lydia Maria Child wrote about– might become more or less prominent at various points in time. For some topics, such as the Mexican-American War, history tells us that there should be a clear starting point. But for other topics, such as the one that seems to describe civil rights, their prevalence may wax and wane over time. Did Child employ the language of the home to advocate for equal rights, as Garrison hoped she would? Or did she merely adopt the more direct line of argument that other (male) editors employed?
To begin to answer these questions, our interface needed to support nuanced scholarly inquiry. More specifically, we wanted the user to be able to identify significant topics over time for a selected subset of documents– not just in the entire dataset. This subset of documents, we thought, might be chosen by specific metadata, such as newspaper title; this would allow you to see how Child’s writing about civil rights compared to other editors work on the subject. Alternately, you might, through a keyword search, choose to see all the documents that dealt with issues of rights. So in this way, you could compare the conversation around civil rights with the one that framed the discussion about women’s rights. (It’s believed that the debates about the two issues developed in parallel, although often with different ideological underpinnings).
At this point, it’s probably also important to note that in contrast to earlier, clustering-based techniques for identifying themes in documents, topic modeling can identify multiple topics in a single document. This is especially useful when dealing with historical newspaper data, which tends to be segmented by page and not article. So you could ask: Did Child begin by writing about civil rights overtly, with minimal reference to domestic issues? Or did Child always frame the issue of civil rights in the context of the home?
 Our first design was based on exploring these changes in topical composition. In this design, we built on the concept of a dust-and-magnets visualization. Think of that toy where you could use a little magnetized wand to draw a mustache on a man; this model treats each topic as a magnet, which exerts force multiple specks of dust (the individual documents). (At left is an image from an actual dust-and-magnets paper).
In our adaptation of this model, we represented each newspaper as a trail of dust, with each speck– or point– corresponding to a single issue of the newspaper. The position of each point, on an x/y axis, is determined by its topical composition, with respect to each topic displayed in the field. That is to say– the force exerted on each newspaper issue by a particular topic corresponds to the strength of that topic in the issue. In the slide below, you can see highlighted the dust trail of the Anti-Slavery Bugle as it relates to five topics, including the civil rights and women’s rights topics previously mentioned. (They have different numbers here). I also should note that for the dust trails to be spatially coherent, we had to apply some smoothing. We also used color to convey additional metadata. Here, for instance, each color in a newspaper trail corresponds to a different editor. So by comparing multiple dust-trails, and by looking at individual trails, you can see the thematic differences between (or within) publications.
 Another issue addressed by this design is the fact that documents are almost always composed of more than two topics. In other words, for the topics’ force to be represented most accurately, they must be arranged in an n-dimensional space. We can’t do that in the real world, obviously, where we perceive things in three dimensions; let alone on a screen, where we perceive things in two. But while multidimensional information is lost, it’s possible to expose some of this information through interaction. So in this prototype, by adjusting the position of each topic, you can move through a variety of spatializations. Taken together, these alternate views allow the user to develop an understanding of the overall topical distribution.
This mode also nicely lends itself to our goal of helping users to “drill down” to a key subset of topics and documents: if the user determines a particular topic to be irrelevant to the question at hand, she can simply remove its magnet from the visualization, and the dust-trails will adjust.
This visualization also has some substantial disadvantages, as we came to see after exploring additional usage scenarios. For one, the topical distributions computed for each newspaper are not guaranteed to vary with any consistency. For instance, some topics appear and disappear; others increase and decrease repeatedly. In these cases, the resultant “trails” are not spatially coherent unless smoothing is applied after the fact. This diminishes the accuracy of the representation, and raises the question of how much smoothing is enough.
Another disadvantage is that while the visualization facilitates the comparison of the overall thematic trajectories of two newspapers, it is not easy to align these trajectories– for instance, to determine the thematic composition of two newspapers at the same point in time. We considered interactive solutions to this problem, like adding a clickable timeline that would highlight the relevant point on each dust trail. However, these interactive solutions moved us further from a visualization that was immediately intuitive.
At this point, we took a step back, returning to the initial goal of our project: facilitating humanities research through technically-sophisticated means. This required more complex thinking about the research process. There is a difference, we came to realize, between a scholar who is new to a dataset, and therefore primarily interested in understanding the overall landscape of ideas; and someone who already has a general sense of the data, and instead, has a specific research question in mind. This is a difference between the kind of exploration theorized by Tukey, and a different process we might call investigation. More specifically, while exploration is guided by popularity—what topics are most prominent at any given time—investigation is guided by relevance: what topics are most germane to a particular interest. We wanted to facilitate both forms of research in a single interface.
 With this design, at left, it’s time that provides the structure for the interface, anchoring each research mode– exploration and investigation– in a single view. Here, you see the topics represented in “timeline” form. (The timeline-based visualization also includes smooth zooming and panning, using D3’s built-in zoom functionality). The user begins by entering a search term, as in a traditional keyword search. So here you see the results for a search on “rights,” with each topic that contains the word “rights” listed in order of relevance. This is like the output of a standard search engine, like Google, so each topic is clickable– like a link.
Rather than take you to a web page, however, clicking on a topic gets you more information about that topic: its keywords, its overall distribution in the dataset, its geographical distribution, and, eventually, the documents in the dataset that best encapsulate its use. (There will also be a standalone keyword-in-context view).
Another feature under development, in view of our interest in balancing exploration and investigation, is that the height–or thickness- of any individual block will indicates its overall popularity. (We actually have this implemented, although it hasn’t yet been integrated into the interface you see). For example, given the query “rights,” topic 59, centered on women’s rights, represented in blue at the top right, may be most relevant– with “rights” as the most statistically significant keyword. But it is also relatively rare in the entire dataset. Topic 40, on the other hand, which deals with more general civil and political issues, has “rights” as a much less meaningful keyword, yet is extremely common in the dataset. Each of these topics holds significance for the scholar, but in different ways. Our aim is to showcase both.
 Another feature to demonstrate is a spatial layout of topic keywords. In the course of the project’s development, we came to realize that while the range of connotations of individual words in a topic presents one kind of interpretive challenge, the topics themselves can at times present another– more specifically, when a topic includes words associated with seemingly divergent themes. So for instance, in T56, the scholar might observe a (seemingly) obvious connection, for the nineteenth-century, between words that describe Native Americans and those that describe nature. However, unlike the words “antelope” or “hawk,” the words “tiger” and “hyena,” also included in the topic, do not describe animals that are native to North America. Just looking at the word list, it’s impossible to tell whether the explanation lies in a new figurative vocabulary for describing native Americans, or whether this set of words is merely an accident of statistical analysis.
 So here, on the left, you see a spatial visualization of the topic’s keywords using multidimensional scaling, in which each keyword is positioned according to its contextual similarity. Here, the terms “indian”, “indians”, and “tribes” are located apart from “hyena”, “tiger”, and “tigers”, which are themselves closely associated. The spatial layout suggests a relatively weak connection between these groups of terms. For comparison, at right is a spatial visualization for a topic relating to the Mexican-American War, in which terms related to the conduct of the war are spatially distinguished from those related to its outcome.
 But returning, for a minute, to the overall view, I’ll note just that there are limitations to this interface as well, owing to the fact of translating textual and temporal data into a spatial view. Through our design process, though, we came to realize that the goal should not be to produce an accurate spatial representation of what is, after all, a fundamentally non-spatial data. Rather, our challenge was to create a spatial transformation, one that conveyed a high density of information while at the same time allowed the scholar to quickly and easily reverse course, moving from space back to the original, textual representation.
Our project is far from concluded, and we have several specific steps we plan to accomplish. In addition to implementing the information about specific topics, our most pressing concern, given our interest in moving from text to space and back to text again, is to implement the KWIC view. We also plan to write up our findings about the newspapers themselves, since we believe this tool can yield new insights into the story of slavery’s abolition.
But I want to end with a more theoretical question that I think our visualization can help to address– in fact, one that our interface has helped to illuminate without our even trying.
 I began this presentation by showing you some images from Henry Gannett’s Statistical Atlas of the United States. You’ll notice that one of these images bears a striking similarity to the interface we designed. Believe it or not, this was unintentional! We passed through several intermediary designs before arriving at the one you see, and several of its visual features: the hexagon shape of each blog, and the grey lines that connect them, were the result of working within the constraints of D3. But the similarities between these two designs can also tell us something, if we think harder about the shared context in which both were made.
 So, what do we have in common with Henry Gannett, the nineteenth century government statistician? Well, we’re both coming at our data from a methodological perspective. Gannett, if you recall, wanted to elevate statistics in the public view. By integrating EDA into our topic model exploration scheme, our team also aims to promote a statistical mode of encountering data. But that I refer to our abolitionist newspaper data as “data” is, I think, quite significant, because it helps to expose our relation to it. For antislavery advocates at the time– and even more so for the individuals whose liberty was discussed in their pages– this was not data, it was life. So when we are called upon, not just as visualization designers, but as digital humanities visualization designers, to “expose the constructedness of data”—that’s Johanna Drucker again, who I mentioned at the outset. Or, to put it slightly differently, to illuminate the subjective position of the viewer with respect to the data’s display, we might think of these different sets of data, and their similar representations—which owe as much to technical issues as to theoretical concerns–and ask what about the data is exposed, and what remains obscured from view. That is to say, what questions and what stories still remain for computer scientists, and for humanities scholars, working together, to begin to tell?


 At this point, it also bears mention that for Peabody, the creation of knowledge took place through a second mode: through the act of creating the images themselves. Peabody also printed workbooks, with sheets like the one you can see at left, and she envisioned the exercise, ideally, as one not merely of cross-referencing events to their visual representation, but of constructing the images they would then study. So you can see one student’s attempt below-left. And below on the right is another, by someone who appears to have given up all together. (These images come from


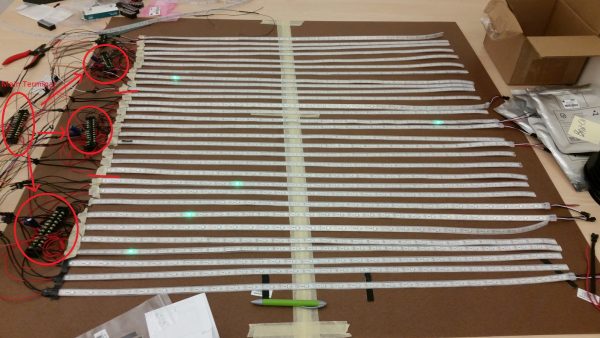
 This feature has prompted me to undertake a second project to implement a floor-size version of Peabody’s charts, which you can see at lest in some very early phases. (You can read about our current progress


 Data visualization is not a recent innovation. Even in the eighteenth century, economists and educators, as well as artists and illustrators, were fully aware of the inherent subjectivity of visual perception, the culturally-situated position of the viewer, and the power of images in general—and of visualization in particular—to convey arguments and ideas.


